[Paper Reading] An Automated IoT Visualization BIM Platform for Decision Support in Facilities Management
2022, Jan 21
Publication year: 2018
Authors: Kai-Ming Chang, Ren-Jye Dzeng and Yi-Ju Wu
DOI: https://doi.org/10.3390/app8071086
Introduction
- Driven by the recent development of a variety of enabling wireless technologies, the IoT (Internet of Things) has stepped out of its infancy, and is expected to be the next revolutionary technology that will create the fully integrated internet of the future
- BIM is a common knowledge resource that can be used to share and provide reliable information on a facility throughout the building life cycle, and can be used to retain, transfer and reapply information at all stages of the traditional building life cycle
- The IFC standard provides a logical hierarchy of building elements/objects through the definitions of various domains, and enables professionals to exchange information within a defined scope when they carry out feasibility studies, design or construction simulation, and operation. The IFC data model is universal, designed to support the full range of modeling operations required by the construction industry, and allows the intuitive viewing of others’ content in stereoscopic 3D. This can effectively reduce the occurrence of errors and flaws, and allows the quick resolution of disagreements and mistakes among professionals. BIM employing the IFC standard can therefore minimize or eliminate costs and waste of time resulting from extensive rework.
- BIM models are useful and effective in assessing the energy efficiency of buildings through the use of design parameters associated with a model, such as the shape, orientation, materials and windows of a building, as well as external environmental information relevant to the building (such as sun location, solar radiation, temperature and humidity).
- While the BIM modeling technology encompasses building information and visualization, it lacks the means to incorporate information concerning the immediate environment into the model, and must be aided by a plug-in (e.g., Revit API, Firefly) if it is to achieve a further step towards intelligent building.
- Most existing cases in the literature successfully solved target facility management problems through the use of numerical computations using data from sensors monitoring building spaces. However, failure to integrate the data with a BIM model of the building will hinder the facility manager’s ability to identify potential problems intuitively. This study therefore proposes a platform able to integrate sensor information with BIM.
- The proposed platform has a threefold objective—integration, visualization, and multiple contexts as follows:
- Automated integration: automatically collects data from physical sensors installed in a space, and stores the data in the BIM model of the space.
- Automated visualization: automatically calculates an index value based on the collected sensor data, and computationally visualizes the value with a color palette scheme.
- Multiple contexts: allows a user to switch between different contexts that require different subsets of the sensors (e.g., comfort, energy saving, the WELL Building Standard perspectives) installed in the space.
Research Methodologies and Experiment Design
- Parametric Design-Based Approach
- Dynamo (a free plug-in for Revit) is a parametric design software that can work closely with BIM-based software such as Revit, and allows a designer to programmatically create 3D BIM components automatically based on certain parameters.
- The Firefly suite is a set of computer code fragments employed to bridge the gaps between BIM-based parametric design software such as Grasshopper, a sensor microcontroller such as Arduino, and other input/output devices Dynamo or such as webcams and mobile phones
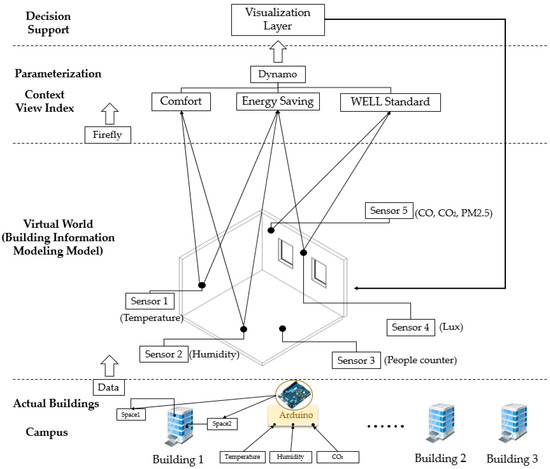
- Actual buildings (campus): The campus includes buildings, and sensors and Arduino were deployed in indoor spaces to perform environmental data collection.
- Virtual world (BIM model): After establishing a virtual 3D space and sensor locations, we input real environmental data into the virtual environment through Firefly
- Data reception and transmission: The Firefly suite is a set of computer code fragments employed to bridge the gaps between BIM-based parametric design software such as Dynamo or Grasshopper, a sensor microcontroller such as Arduino, and other input/output devices, such as webcams and mobile phones.
- Parameterization: Depending on decision-making goals in different situations, the operating rules of custom nodes were established using Dynamo, which includes a context view index (including comfort, energy saving, and the WELL Standard).
- Decision support: visualization layer input to the BIM model.
- The proposed platform’s four modules consisted of sensor data collection, sensor data integration, parametric control mechanism, and visualization modules
- Experimental design
- Scenario Assumptions
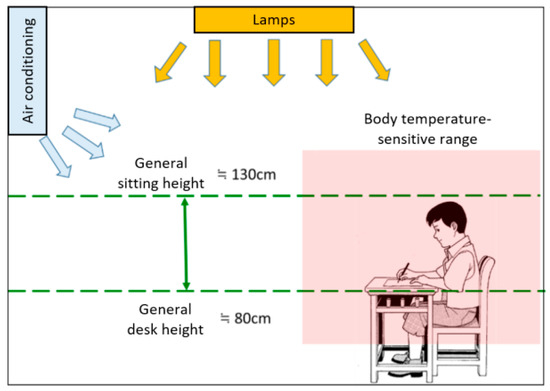
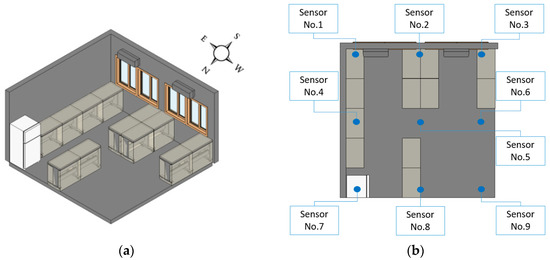
- This study targeted student lectures in a typical classroom, and assumed that their comfort was only affected by the temperature and humidity at a height of 80–130 cm above the ground
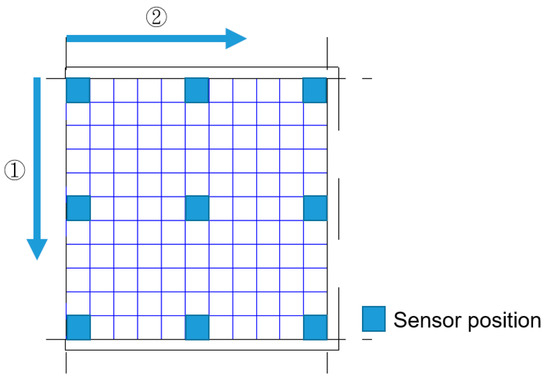
- The sensors were installed in a total of nine locations along the edges and in the center and corners of the campus research laboratory for the purpose of the experiment
- Scenario Assumptions
- Arduino Microcontroller
- This paper used the Arduino Mega 2560 R3 microcontroller board, which was connected to sensors (DHT-11) measuring the temperature and humidity of the indoor space
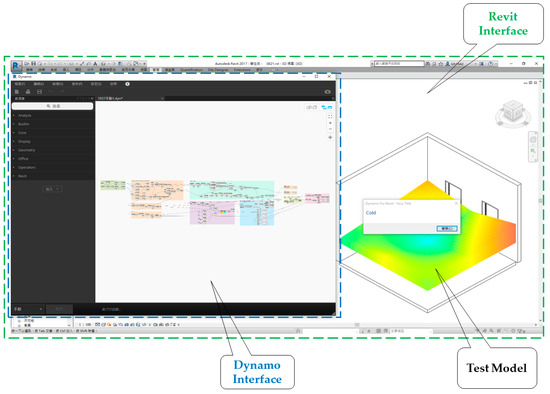
- Dynamo Automation platform
- This study used Dynamo to establish a temperature and humidity data automation platform. Arduino microcontrollers were employed to collect temperature and humidity data in the classroom
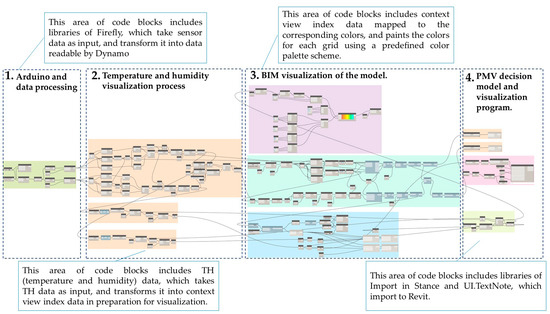
- The platform was established employing the following four steps:
- Use the Firefly suite to create a node linking Dynamo and Arduino, forming a basis for interactive prototyping and importing environmental data into Dynamo
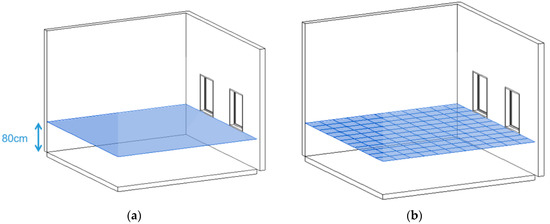
- The interpolation method was used to calculate the value of each grid square. The visualization components of the context view index and the RGB color rendering values of the grid squares are as shown in Figure
- The code fragments first create a layer component in BIM at the predefined elevation, collect sensor data and calculate the context view index (PMV) for each grid in the layer using interpolation, and then paint the corresponding color for each grid based on the predefined color palette scheme.
- Decisions concerning the indoor comfort pointer are based on predicted mean vote (PMV), and the results of analysis can be presented in the BIM model on this platform. Note that PMV is a common metric for assessing the comfort level of an indoor environment, and has been adopted in ISO 7730
- PMV can be caculated based on factors including the body’s metabolic rate and clothing insulation, as well as environmental parameters (air temperature, average radiant temperature, relative air velocity and humidity). According to ISO 7730, an ideal PMV value is between -0.5 and +0.5
Case Demonstration
- This section uses an actual case to demonstrate the use of the proposed IoT visualization platform, which includes multiple temperature and humidity sensors and an Arduino microcontroller, and shows how a facility manager may adjust the layout of a space based on the visualized PMV comfort values.
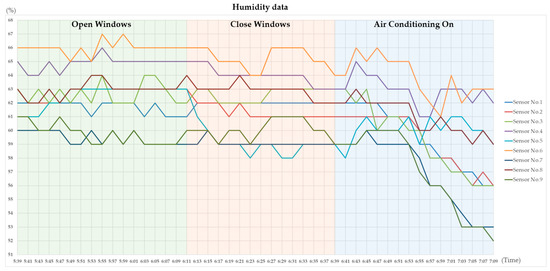
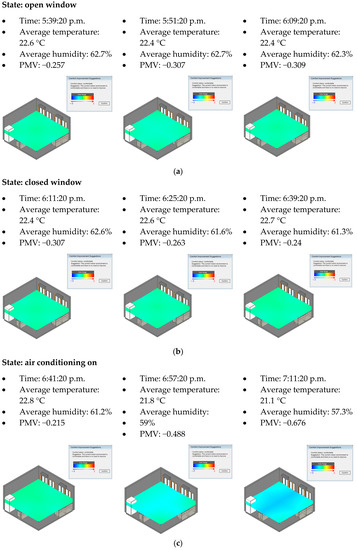
- Figure 17 show snapshots of the visualized comfort level during different conditions, such as when the windows are open, when the windows are closed, and when the air conditioning is on, with the corresponding comfort level and improvement suggestions made by the platform developed in this study shown by the side.
- The experiment was conducted during the winter in Taiwan, and the results showed that differences in temperature and humidity were not apparent during a short period of time in this semitropical area. When the air conditioner was turned on, both the temperature and humidity appeared to decrease, but according to the PMV value, the room remained comfortable during all three states.
Discussion
- Comparison with Conventional Sensor Data Representation
- The system display shows that while the conventional display focuses on individual instantaneous data or a time series of data from individual sensors, the proposed platform displays integrated values in a colorful three-dimensional fashion as a layer in a three-dimensional space. This provides the facility manager with a better means of visualizing and identifying potential facility management problems.
- The context view index shows that the conventional system can only provide data from individual sensors, while the proposed platform can not only display a color visualization of data from each individual sensor, but also the visualization of the PMV context view, which consists of the integrated data values from related sensors.
- Reusability of the Proposed Systems
- When applying the system to a different space with the same context view (such as comfort PMV index), the sensors and microcontroller can be physically moved to the new target space, and a BIM model provided for that space.
- When applying the system to a different space with a different context view, such as when concerned about the air quality in an auditorium, the air quality index in the WELL Building Standard can be used as the context view; in this case, a different set of sensors, such as PM2.5, PM10, and carbon monoxide sensors, can be deployed in the auditorium, and the formula in the context viewer computation block of the data visualization process can be changed in accordance with the new air quality index
Conclusion
- Summary
- This study proposed a platform for transforming sensor data to context-based visualized data (comfort level in this case) and presenting the resulting color visualization via a BIM model. Such visualization allows a facility manager to see the distribution of values from the perspective of the desired context, and thus make appropriate adjustments.
- Future works
- In the future, our research project will continue to experiment with different types of spaces with different settings and use scenarios.
- In addition, we will also expand the platform’s sensing capabilities to such other contexts as energy saving and lighting comfort.
- Contribution
- The contribution of this study is the proposal of the concept of integrating sensor information and an architectural model, while adding visual layers expressing different perspectives on top of a BIM model to support facility management decisions, and demonstrating the feasibility of the concept using existing software tools.