[Paper Reading] Longitudinal dataset of human-building interactions in U.S. offices
2023, Dec 27
Publication year: 2019
Authors: Jared Langevin
Background & Summary
- In recent years, an occupant behavior research community has formed around a collection of studies that quantify the magnitude of occupant behavior’s influence on energy use and comfort
- In parallel, a new paradigm of occupant-centric building control has emerged that tunes centralized building operation strategies to real-time feedback on occupant presence, comfort and preferences.
- While the importance of the human-building interaction is well established, however, the mechanisms that drive this interaction remain largely undetermined. Improving the understanding of these mechanisms requires the collection of longitudinal data, which allow one to observe occupant comfort and adaptive behavior as they evolve together across the day and season.
- Longitudinal measurements of building occupants are time-consuming and expensive to carry out, and publicly available comfort and behavior data remain limited in their coverage of certain adaptive actions, building types and climates.
- Moreover, existing studies rarely examine action hierarchies across several possible thermal behaviors, or the relationship between behavior diversity across an occupant population and individual-level thermal preferences. New longitudinal datasets that address such shortcomings are needed to improve the understanding of interactions between occupants and the built environment.
- U.S. Offices were chosen as the context for the research because of their prevalence in the existing literature on occupant behavior data collection and because they are responsible for the most energy use of any single commercial building type in the U.S.
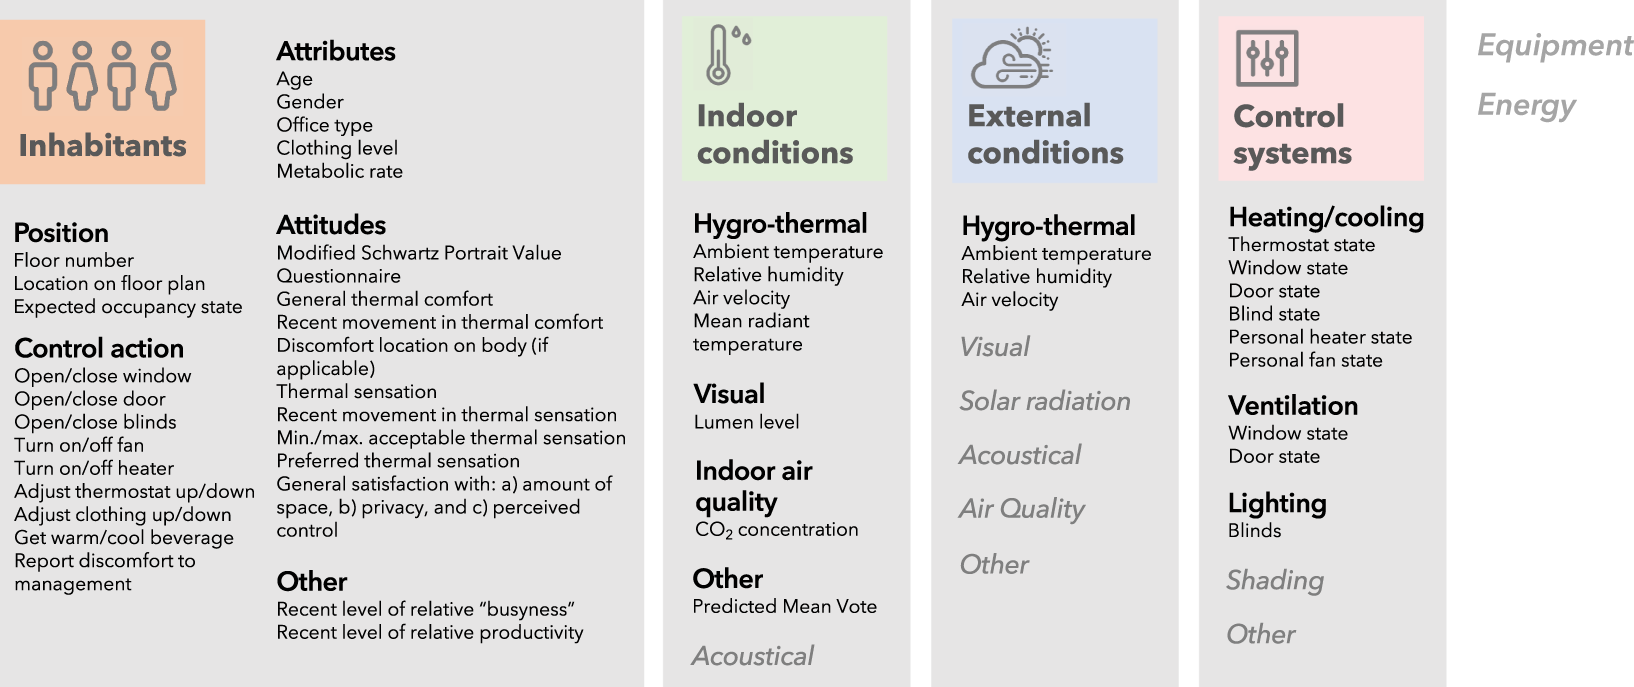
- The primary objective of the data collection approach was to record a comprehensive range of exogenous and endogenous factors that may drive personal comfort and behavior outcomes over time, where the latter have not been explored in previous longitudinal studies of occupant behavior despite their suggested importance in previous behavior research.
Methods
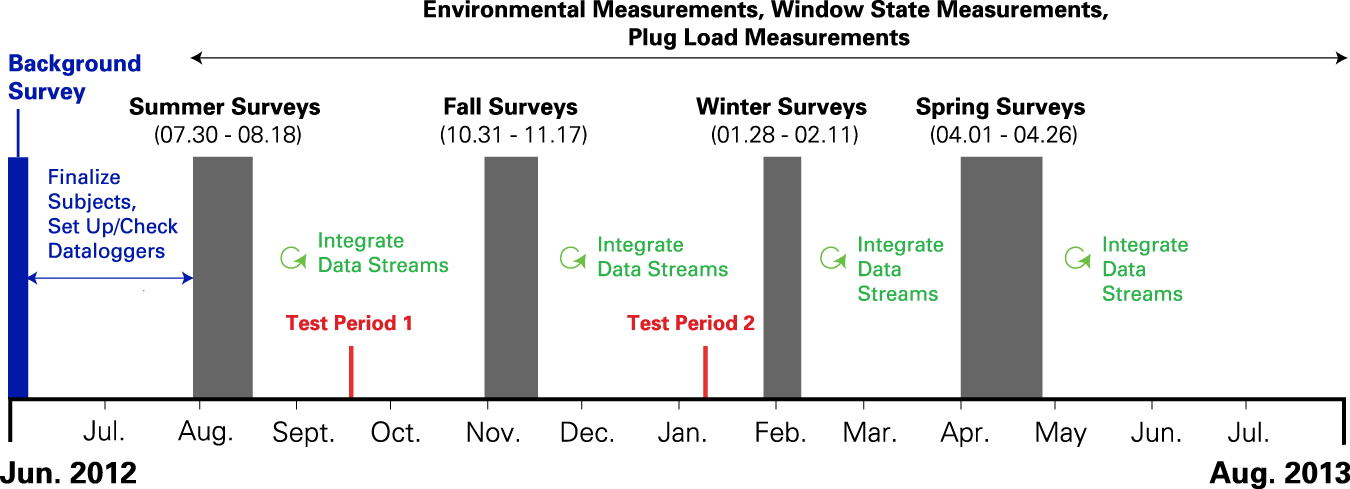
- Longitudinal data on building occupant behavior, comfort, and environmental conditions were collected between July 2012 and August 2013 at the Friends Center office building in Center City Philadelphia, Pennsylvania, United States. Data collection proceeded in three stages, described further below: (1) semi-structured interviews, (2) site selection and subject recruitment for the longitudinal study, and (3) longitudinal survey and datalogger measurements.
Semi-structured interviews
- Semi-structured interviews identify aspects of behavior that are not yet well known or understood and provide a rich qualitative context for developing and interpreting responses from structured survey instruments. To inform the longitudinal portion of the current study, 32 interviews about thermal comfort and related behaviors were first conducted with office occupants from 7 air-conditioned buildings around the Philadelphia region.
Site selection and subject recruitment for the longitudinal study
- The Friends Center office building in downtown Philadelphia was chosen for the full longitudinal study following its inclusion in the semi-structured interviews. At 5200 m2 and four floors (one sub-grade), the Friends Center represents a medium-sized office for the region.
- Work spaces in the Friends Center include single and shared private offices (enclosed by full height, opaque walls with interior windows), partially open offices (cubicles defined by partial height, opaque partitions), and fully open offices; offices are located at either the core or perimeter of the building floor plan.
- Subject recruitment was initiated through an e-mail message sent to all employees in the Friends Center by its Executive Director.
- The following question areas were included: (a) demographic information, (b) office characteristics, (c) thermal comfort and preferences, (d) control options, (e) personal values, and f) typical work schedule (arrival, lunch, departure times). A full background survey instrument is available for testing.
- The background survey generated a total of 45 occupant responses; from this initial sample, a final sample of 24 occupants was selected for participation in the full longitudinal study using a non-proportionate quota sampling strategy.
Longitudinal survey measurements
- Over the course of the following year, the final occupant sample participated in a series of subjective and objective measurements of thermal comfort, adaptive behavior, and related items. These measurements were carried via longitudinal online surveys, as well as through parallel datalogger and BAS measurements of the local environment and behavioral actions; the surveying approach is first outlined here.
- Longitudinal surveys were distributed online via SurveyGizmo three times daily (morning, mid-day, afternoon) for a two week period in each of the four seasons, with the time of each survey distribution tailored to work schedules that occupants reported on the background survey.
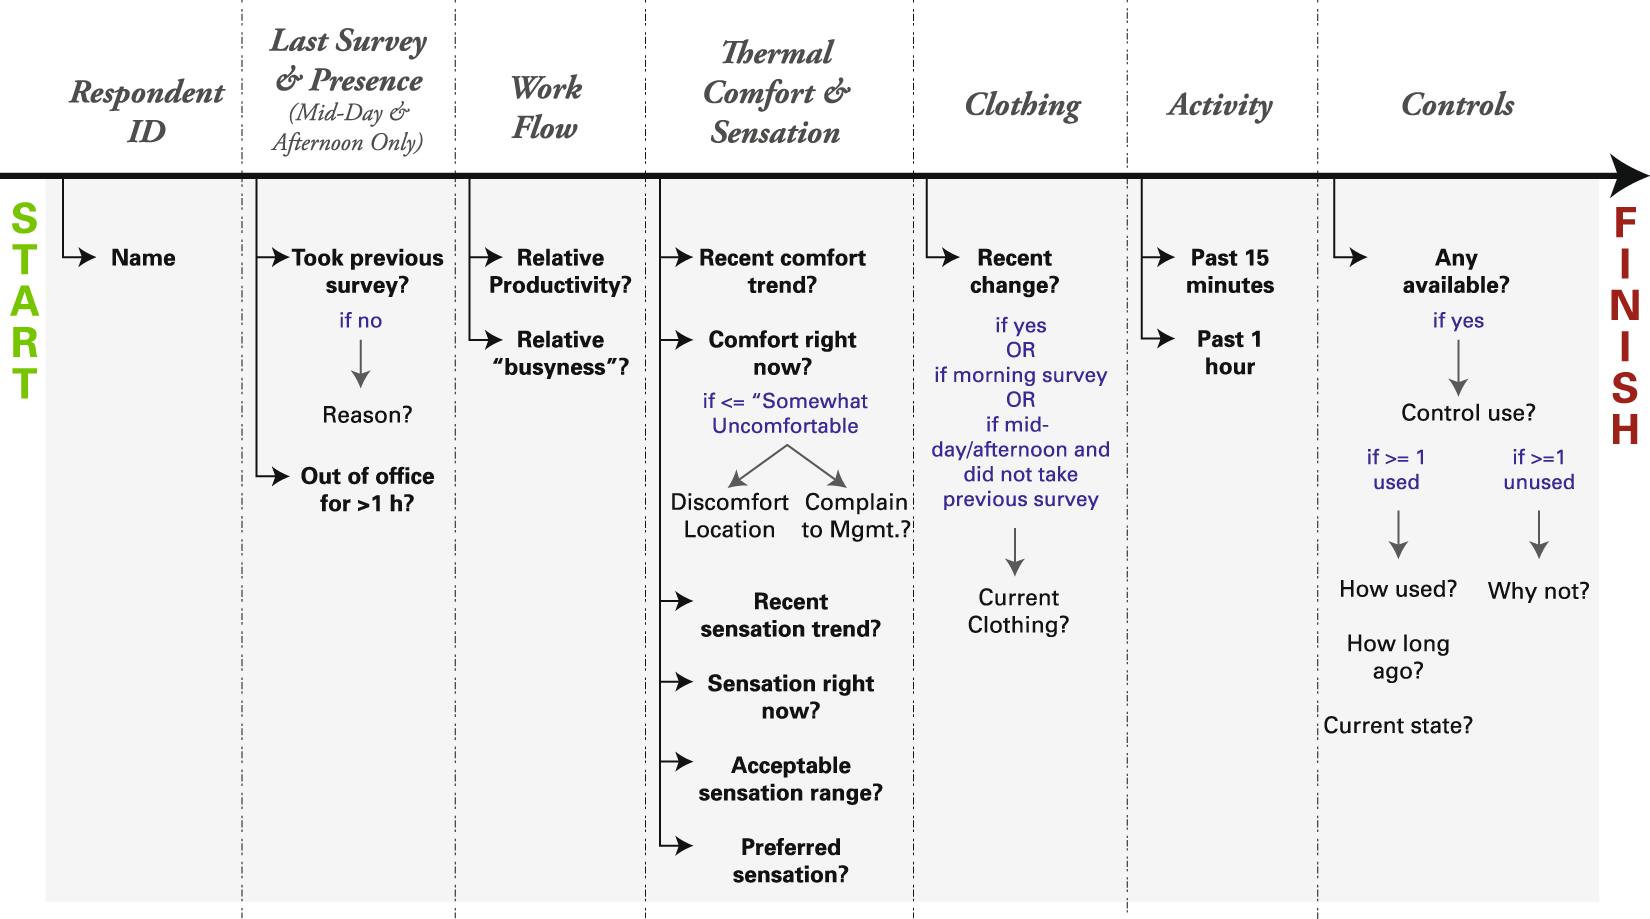
- The daily survey instruments included questions about recent work flow, current thermal comfort and sensation, current and recent clothing levels, recent activity, and recent control use.
- Many of the daily survey questions shown in Fig. 2 follow a “show when” logic, where their appearance is conditional on a response to a previous question. The use of “show when” logic minimizes unnecessary questioning, keeping survey completion times down and combating possible survey fatigue.
- Once the daily surveys had been filled out for the full two week period, each occupant completed a final survey that asked about the whole of their two week experience.
- The final survey asked occupants to log any times when they were out of the office for a significant time (e.g., a whole or half day), also querying general comfort and the frequency of behaviors during the previous two week period.
- Overall, the daily surveys generated consistently high response rates (>=85% in each season), yielding a total of 2503 responses from the 24 subjects.
environment and behavior datalogger and building automation system (BaS) measurements
- Regarding interior conditions, ambient temperature was measured for every occupant using the nearest thermostat reading logged by the BAS system at 15 minute intervals. Ambient temperature and relative humidity were also logged at 5 minute intervals for 11 occupants using HOBO U12-013 base sensors (accuracy: +/−0.35 °C temperature, +/−2.5% humidity), as was globe temperature in eight cases (TMC6-HE attachment covered with 40 mm black matte ping pong ball; +/−0.25 °C accuracy), and air velocity in four cases (T-DCI-F900-S-O attachment; +/−0.05 m/s accuracy).
- Additionally, illuminance and CO2 concentration were logged for certain occupants across floors using the HOBO U12-012 sensor (accuracy dependent on wavelength31) and the TelAir 7001 CO2 sensor (accuracy: greater of +/−50 ppm or 5% of reading), respectively.
- Datalogger measurements of occupant behavior recorded window adjustments and the use of personal fans and heaters.
- Together with the daily survey responses, the above environment and behavior information comprises six longitudinal data streams (daily surveys, outdoor weather, BAS thermostats, local environment, personal fans and heaters, and windows).
technical Validation
Survey preparation phase
- Longitudinal survey design was informed by preceding semi-structured interviews with office occupants along with background surveys of each occupant’s demographic characteristics, thermal comfort, and adaptive behavioral tendencies.
encourage high response rates
- The inclusion of financial incentives for participants and use of “show-when” logic to minimize survey fatigue yielded a high overall response rate of 86% across the longitudinal surveys (Table 2), ensuring the survey data are not biased towards respondents with higher participation rates.
Pilot studies
- Three small pilot studies were conducted during the course of the full longitudinal study: one in the month preceding the start of the study, during which time all required dataloggers were installed and collecting test data, and two in the periods between the summer and fall and fall and winter daily surveys, during which times improved survey deployments were tested alongside logger data collection. The pilot studies verified that all data collection devices and the online survey platform were functioning properly before each of the two week daily surveying periods was conducted.
Quality control
- Datalogger readings were downloaded regularly (at maximum every 2 weeks) to ensure their proper functionality and, in the case of environmental sensors, to verify that readings had not drifted significantly. Between these download times, sensor operation was visually inspected every few weekdays to ensure the devices were actively recording data and had not been moved or dislodged by occupants.
Redundancy
- In the case of outdoor and indoor temperature, parallel data streams were compared to address internal validity.
Comparison against expected conditions
- One year inter-quartile ranges for each of the environmental variables in Table 3 are consistent with those expected of an air-conditioned U.S. office building with occupants that report high levels of general environmental satisfaction.